Dennis Matthews on “STATE OF THE ENERGY MARKET Australian Energy Regulator May 2017”
Retired coal generators are being replaced (but not by other coal generators) by private investment in (on-grid) wind and (off-grid) solar generators.
 Dennis Matthews, 9 June 17 Comments on “STATE OF THE ENERGY MARKET Australian Energy Regulator May 2017”
INTRODUCTION This is a very informative report but it has a few features that detract from its overall impact.
The report is about energy, specifically electrical energy and gas. I will comment on only the electricity sections of the report.
There are a number of occasions where the generic term ‘energy’, and the term ‘power’ need to be replaced by ‘electricity’. For example, in sections dealing with the high voltage transmission of electricity it refers to the “transmission of power”, whereas sections dealing with the low voltage distribution of electricity it refers to the “distribution of electricity”. The difference between transmission and distribution is the voltage.
The term ‘power’ refers to the capacity of the electricity generator, e.g., a 250 MW (megawatt) power station. Once the power station is doing useful work it provides electricity, which is the product of the power by the time for which the electricity is consumed eg., 250 megawatt used for one hour, or 100 MW for 2.5 hours, consumes 250 MWhr of electrical energy.
There are a number of occasions where the report doesn’t make the distinction between grid electricity and all electricity.
The acronym ‘NEM’ (National Electricity Market) is sometimes used to refer to the market and sometimes to the geographical region serviced by the market.
Much of the data only includes up to 2014-15 and hence is nearly two years out of date.
Although the report refers to the vertical integration of the electricity industry, especially ownership of both electricity retail and generation businesses, it makes no mention of the fact that before privatisation Federal Government policy resulted in the disintegration of the publicly owned industry in the name of increased competition and efficiency. Nor does it mention why, since privatisation in Victoria and SA, re-integration has been allowed by the Federal Government.
The following sections use the same headings as in the report.
SNAPSHOT National Electricity Market
“Coal generators are being retired and not replaced, removing significant capacity from the market.”
“private investment in new plant has stalled”
Retired coal generators are being replaced (but not by other coal generators) by private investment in (on-grid) wind and (off-grid) solar generators.
Governments have announced plans to invest “in gas, pumped hydro and energy storage”. Pumped hydro is a form of energy storage rather than an energy source.
Regulated energy networks
“While slower growth in demand for energy …. ”. It is not clear whether ‘energy’ means energy in general, or ‘electricity’, or ‘grid electricity’.
MARKET OVERVIEW
A.2 National Electricity Market
Closures of fossil fuel power stations amounting to over 2000 MW is compared to South Australia’s generating capacity. Although two of the closures – the coal-fired Northern (SA) and Hazelwood (Victoria) power stations – affect SA, it is inappropriate to compare the withdrawal of over 2000 MW from the market with South Australia’s generating capacity, especially considering the amount of non-fossil capacity recently installed in SA.
The use of the acronym NEM in Figure 1 “Renewable generation contribution to NEM electricity supply” is ambiguous. The figure includes contributions from rooftop solar, most of which is not part of the market. In this case ‘NEM’ presumably refers to the NEM region.
Figure 2 “Effect of plant closures on generation capacity” appears to apply only to grid electricity, that is to the NEM.
A.4 Networks
Reference to “moderation in energy demand” is unclear as to what it means by ‘energy’, it probably refers to grid electricity.
Figure 7 ‘Effect of AER decisions on residential energy retail bills (annual)’ does not provide the year to which the bills refer.
- NATIONAL ELECTRICITY MARKET
There are a number of occasions when the high voltage transmission lines are said to carry ‘power’ rather than electricity. For example “The NEM’s transmission grid ….. carries the power from electricity generators”. Given that the transmission lines do much the same as the low voltage distribution lines, except at a higher voltage, it is mystifying why the report should choose to say the former carries power whilst the latter is said to carry electricity.
There is also a tendency to use the generic term ‘energy’ where the more specific term ‘electricity’ is more accurate. For example “the supply of electricity to energy customers” and “Energy retailers act as market intermediaries by buying electricity”.
1.1 Electricity demand
The acronym ‘NEM’ (National Electricity Market) is used ambiguously. For example, Figure 1.1 ‘Electricity demand in the NEM’ shows a component for non-grid ‘rooftop solar PV’, which is “not traded through the NEM”, but is generated and consumed in the NEM region.
The determination of the NEM settlement price paid to generators supplying electricity to the market is somewhat mysterious. According to the report
“The settlement price paid to generators is the average dispatch price over 30 minutes.”
This seems to imply that the settlement price (which all contributing generators receive, irrespective of what they bid into the market) for a 30 minute interval would be obtained by taking the offers ($/MWhr) accepted for each generator, multiplying by the MWhr supplied by each generator, summing to get the total cost, and then dividing the total cost of electricity supplied by the total MWhr supplied. This is not the way it works.
The dispatch price is determined from the generator offer prices (bids) over a 5 minute interval, and “The highest priced offer needed to meet demand becomes the dispatch price” for the 5 minute interval. So, even if one generator offered to supply some electricity at $35/MWhr and another at $50/ MWhr but the highest offer accepted was $10,000/MWhr, then every generator gets $10,000/MWhr (the dispatch price) for that 5 minute period.
- Maximum grid demand The heading is ambiguous. Does maximum grid demand mean the maximum amount of electricity (MWhr) that flows through the grid, or does it mean the maximum power (MW) that generators produce? The report seems to sometimes means ‘maximum electricity’ and at others ‘maximum power’.
- Plant technology and carbon emissions
The report says that “state governments have operated feed-in tariff schemes that subsidise solar PV generation.” Given that solar PV did not receive time-of-day prices then when thermal power stations were getting spot prices as high as $10,000 a MWhr solar PV was getting a 100 times lower tariff.
- Capacity withdrawals
It is not clear whether ‘capacity’ refers to grid-connected capacity or whether it includes non-grid solar PV.
- Supply-demand balanceIt is not clear whether ‘electricity demand’ refers to grid-electricity or whether it includes non-grid solar PV.
1.5.1 Vertical integration
“While governments structurally separated the energy supply industry in the 1990’s, many retailers later reintegrated with generators to form ‘gentailers’ ”. It is not mentioned that the ‘structural separation’ was a direct result of Federal Government competition policy, that the industry was predominantly publically owned at the time, and that, after privatisation in Victoria and SA, reintegration occurred without any Federal Government action.
- REGULATED ENERGY NETWORKS
“Electricity transmission networks transport power at high voltages” whilst “Electricity distribution networks transport electricity”. It is unclear why electricity transmission networks are said to transport ‘power’ whilst electricity distribution networks transport ‘electricity’.
3.9.3 Demand management and embedded generation
There is no mention of managing electricity demand by providing the same service through substituting for electricity, e.g., substituting electricity with rooftop solar thermal for providing hot water, and substituting electricity for heating and cooling with better building insulation.
No comments yet.
1 This month.
Australians deserve the truth
about
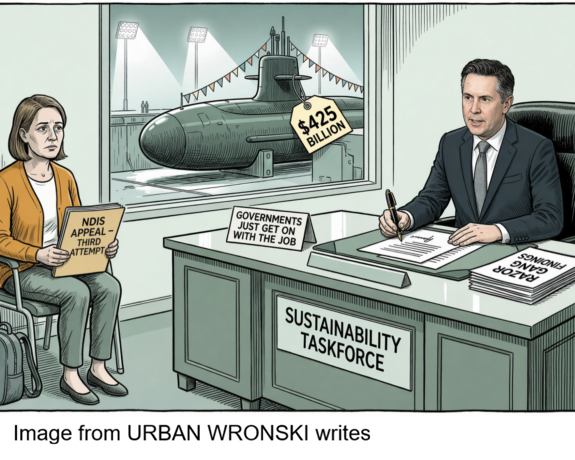
AUKUS – https://aukuspublicinquiry.com/
23 July – Australian Premiere: ‘Our Planet, The People, My Blood’ documentary
Thu, 23 Jul, 10am – 12pm ACST
The Mercury
13 Morphett St, Adelaide SA 5000
Link to register and more information here. tickets free but you must register

30 July – WEBINAR (Free) – Is Nuclear Power the Solution to Climate Change? https://my.acaw.org.au/event/acaw-is-nuclear-power-the-solution-to-climate-change
18:30 – 19:45 ACST
19:00 – 20:15 AEST

PETITION – To: Prime Minister Anthony Albanese and the Australian Labor Government

of the week – Australians for War Powers Reform (AWPR)
To see nuclear-related stories in greater depth and intensity

Leave a comment