AEMO sees South Australia at 73% renewables by 2020/21 — RenewEconomy

AEMO scenarios predict 73% renewables for South Australia by 2020/21, and up to 80% five years later. And is it worried?
via AEMO sees South Australia at 73% renewables by 2020/21 — RenewEconomy
1 Comment »
Leave a comment
1 This month.
4 June Webinar – where is our public inquiry into AUKUS?
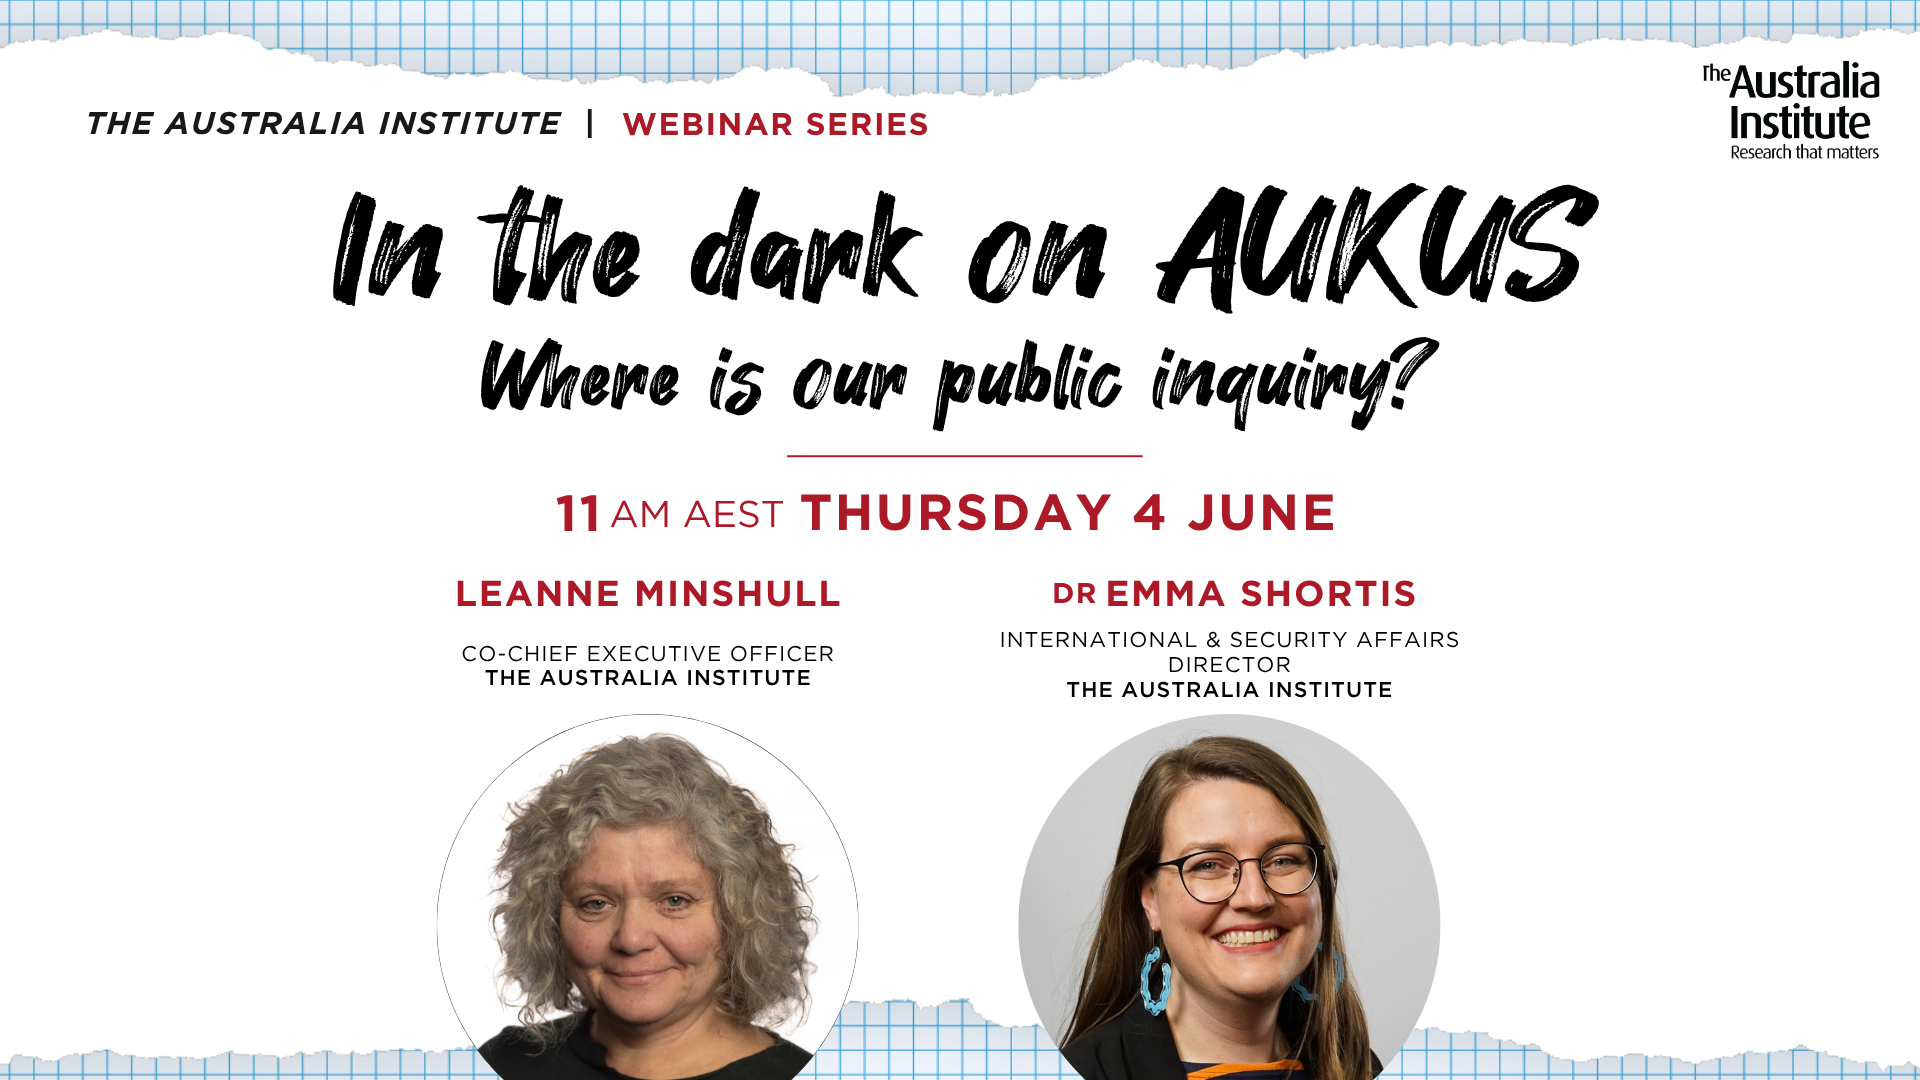
Thu, Jun 04, 2026 11am AEST Zoom. Register at https://nb.australiainstitute.org.au/in_the_dark_on_aukus_where_is_our_public_inquiry

PETITION – To: Prime Minister Anthony Albanese and the Australian Labor Government

of the week – Australians for War Powers Reform (AWPR)
To see nuclear-related stories in greater depth and intensity

This graph and accompanying description is potentially confusing.
Firstly, it is about electricity, a specific form of energy.
Secondly, the heading should refer to energy source not fuel source. Solar, and wind are not fuels they are more correctly described as renewable energy sources. Fuels get burnt and/or consumed in the process, usually producing dangerous, polluting waste products, the vast majority of fuels are non-renewable energy sources (firewood is potentially renewable but not in the same sense as wind and solar).
Thirdly, showing demand on a graph of electricity (MWh) supply is not useful. Showing power (MW) demand makes sense on a graph of power supply because you can have electricity generators generating power but not supplying electricity until they are connected to the grid or other demand. Power supply and demand curves are often quite different.
LikeLike